Python in Scientific Computing
Ondřej Čertík
Los Alamos National Laboratory
Outline
- What is Scientific Computing
- Python ecosystem
- IPython: Interactive Python (Visualize, Interact, Compute)
- SymPy: Symbolic manipulation
- How opensource works
- Python 2 to 3 transition
Beyond (Floating Point) Number Crunching
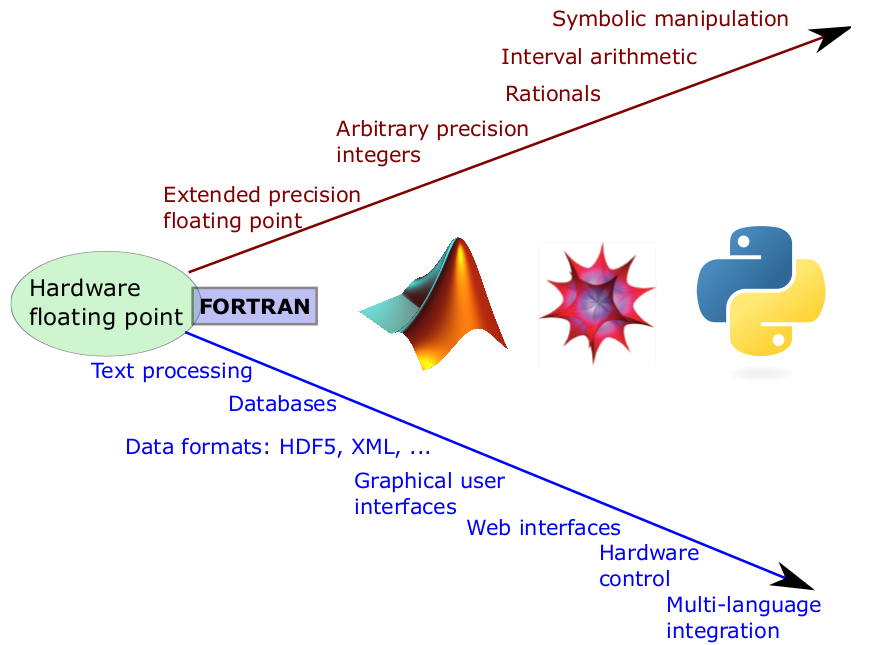
Source: Fernando Pérez
NumPy: the Foundation. Modern Array Processing
- A flexible, efficient, multidimensional array object.
- Convenient syntax: c = a+b.
- Math library that operates on arrays:
y = sin(k*t). - Basic scientific functionality:
- Linear algebra
- FFTs
- Random number generation
Source: Fernando Pérez
Scientific Python: a Rich Ecosystem
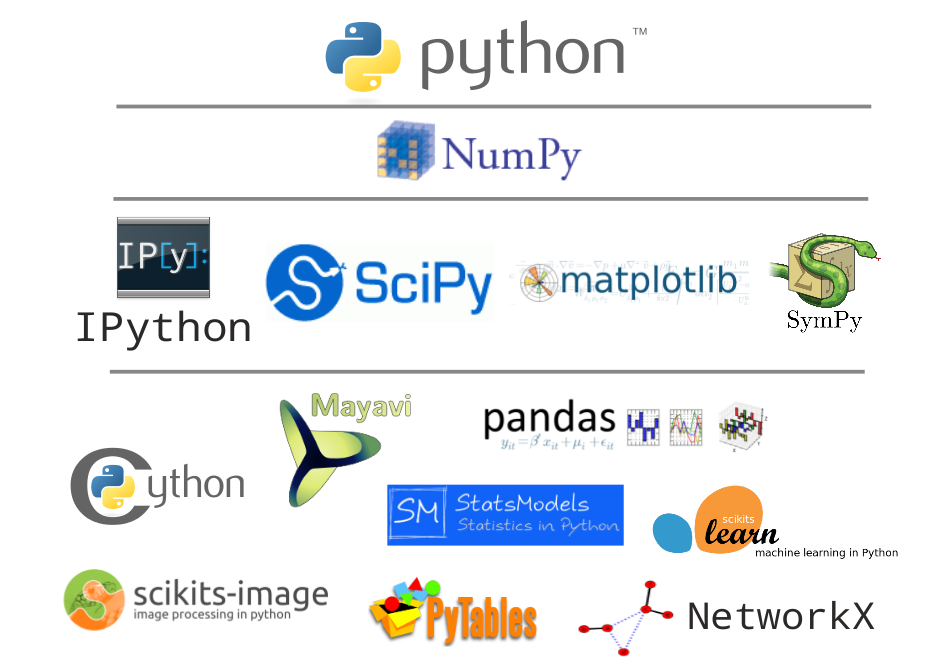
Source: Fernando Pérez
Computing is not the ’third branch’ of science...
It is now the backbone of theory and experiment!
Computing in science must improve drastically before we can really call it scientific.
Source: Fernando Pérez
The Lifecycle of a Scientific Idea (schematically)
- Individual exploratory work
- Collaborative development
- Production work (HPC, cloud, parallel)
- Publication (with reproducible results!)
- Education
- Goto 1.
The Problem with most tools
Barriers and discontinuities in workflow in between all the steps
Source: Fernando Pérez
IPython’s goal:
Fluid transitions in all these steps
Source: Fernando Pérez
1. Individual exploratory work: Visualize, Interact, Compute
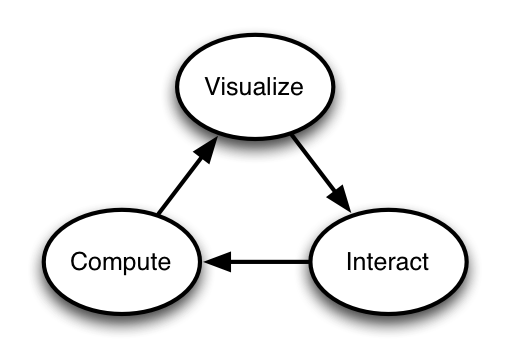
Source: Brian Granger
Simple Matplotlib Demo
from ipywidgets import StaticInteract, RangeWidget, RadioWidget

StaticInteract(plotit,
               amplitude=RangeWidget(0.1, 1.0, 0.1),
               color=RadioWidget(['blue', 'green', 'red']))


Atomic orbitals
from dftatom import atom_lda
from numpy import size

def plotit(Z):
    a = 2.7e6
    rmin = 1e-7
    rmax = 50
    N = 5500
    E_tot, ks_energies, n, l, f, R, Rp, V_tot, density, orbitals = \
            atom_lda(Z, rmin, rmax, a, N, 1e-11, 100, 1e-10, 0.35, 100, True)
    return make_plot(Z, R, orbitals, density)

StaticInteract(plotit, Z=RangeWidget(1, 40))


Demo: My LANL Usage
- Communicating results
- All plots, visualization
Conclusion:
Use IPython. It is only going to get better.
(Incomplete) Cast of IPython Authors
- Fernando Pérez - UC Berkeley
- Brian Granger - Physics, Cal State San Luis Obispo
- Min Ragan-Kelley - Nuclear Engineering, UC Berkeley
- Matthias Bussonnier - Physics, Institut Curie, Paris
- Brad Froehle - Mathematics, UC Berkeley
- Paul Ivanov - Neuroscience, UC Berkeley
- Robert Kern - Enthought
- Thomas Kluyver - Biology, U. Sheffield
- Jonathan March- Enthought
- Evan Patterson - Physics, Caltech/Enthought
- Jörgen Stenarson - Elect. Engineering, Sweden
- Stefan van der Walt - UC Berkeley
- John Hunter - TradeLink Securities, Chicago
- Prabhu Ramachandran - Aerospace Engineering, IIT Bombay
- Satra Ghosh- MIT Neuroscience
- Gaël Varoquaux - Neurospin (Orsay, France)
- Ville Vainio - CS, Tampere University of Technology, Finland
- Barry Wark - Neuroscience, U. Washington
- Ondřej Čertík - Physics, LANL
- Darren Dale - Cornell
- Justin Riley - MIT
- Mark Voorhies - UC San Francisco
- Nicholas Rougier - INRIA Nancy Grand Est
- Thomas Spura - Fedora project
- Many more! (~250 commit authors)
Source: Fernando Pérez
My Involvement with Python Scientific Computing
- I've used Python from about 2001
- On my own (no contact with the community)
- 2005, 2006 I realized that Symbolic capabilities are missing
- 2007 worked on SymPy day and night
- 2007 SciPy conference at Caltech
Example
from sympy import init_printing, var, sqrt, factor, integrate, erf
init_printing(use_latex=True)
var("x")
e = factor(x**36-1)
e
e.expand()
erf(x).series(x, 0, 6)
integrate(1/(x**3+1), x)
SymPy
History
- I started the project in 2006
- Development took off in 2007 when SymPy first participated in Google Summer of Code. We have participated in every Google Summer of Code since.
- In 2011, Aaron Meurer (who also joined from Google Summer of Code) took over as lead developer.
Present (Current Status)
- Over 250 contributors.
- Current code base has over 400,000 lines of code and documentation.
- We are transforming from “sympy a toy” to “sympy a tool”
SymPy Authors
Chris Smith, Aaron Meurer, Mateusz Paprocki, Ondřej Čertík, Matthew Rocklin, Julien Rioux, Ronan Lamy, Raoul Bourquin, Sergey B Kirpichev, Kirill Smelkov, Øyvind Jensen, Tom Bachmann, Mario Pernici, Sergiu Ivanov, Saptarshi Mandal, Stefan Krastanov, Thilina Rathnayake, Rick Muller, Sean Vig, Brian E. Granger, David Li, Vinzent Steinberg, Vladimir Perić, Gilbert Gede, Raymond Wong, Fredrik Johansson, Fabian Pedregosa, Bharath M R, Addison Cugini, Thomas Hisch, Guru Devanla, Manoj Kumar, Alexey U. Gudchenko, Sachin Joglekar, hm, Priit Laes, Prasoon Shukla, Matt Habel, Alan Bromborsky, Timothy Reluga, Tomo Lazovich, Matt Curry, Mary Clark, Pablo Puente, Jason Gedge, Christopher Dembia, Aleksandar Makelov, Katja Sophie Hotz, Brian Jorgensen, Kendhia, Francesco Bonazzi, Ramana Venkata, Andy R. Terrel, Joachim Durchholz, Grzegorz Świrski, Pearu Peterson, Sebastian Krämer, Joan Creus, Siddhanathan Shanmugam, Toon Verstraelen, Cristóvão Sousa, Christian Muise, Jorn Baayen, Jeremias Yehdegho Alexander Hirzel, Kevin Hunter, Matthew Hoff, Riccardo Gori, Steve Anton, Sanket Agarwal, Jason Moore, Robert Schwarz, David Ju, Angadh Nanjangud, Luke Peterson, Oliver Lee, Renato Coutinho, Yuriy Demidov, Bilal Akhtar, Stepan Roucka, Chetna Gupta, Miha Marolt, Stephen Loo, Nathan Alison, Niklas Thörne, Saurabh Jha, jerryma1121, Brian Stephanik, Robert Kern, Sachin Irukula, Sam Sleight, Angus Griffith, Patrick Lacasse, Swapnil Agarwal, Gary Kerr, Mike Boyle, Natalia Nawara, Nicolas Pourcelot, Sherjil Ozair, Ankit Agrawal, Huijun Mai, Jim Zhang, Ljubiša Moćić, Prafullkumar P. Tale, Marek Šuppa, Freddie Witherden, Roberto Nobrega, David Joyner, Felix Kaiser, Friedrich Hagedorn, Randy Heydon, Saroj Adhikari, Sean Ge, Alexey Subach, Alkiviadis G. Akritas, CJ Carey, Eric Nelson, Jaroslaw Tworek, Yuri Karadzhov, Christian Bühler, Rishabh Dixit, Ryan Krauss, Amit Saha, Ananya H, Andreas Kloeckner, Demian Wassermann, Mark Dewing, Min Ragan-Kelley, Raphael Michel, Sam Magura, Tim Swast, Chancellor Arkantos, Chris Wu, Christophe Saint-Jean, Davy Mao, Harold Erbin, Khagesh Patel, Manish Gill, Matthew Brett, Nichita Utiu, Piotr Korgul, Roland Puntaier, Tarun Gaba, Tobias Lenz, Tomasz Buchert, Abderrahim Kitouni
SymPy Authors (continued)
Alexandr Popov, Chris Conley, David Roberts, Florian Mickler, Harsh Gupta, Imran Ahmed Manzoor, Jochen Voss, Nimish Telang, Rom le Clair, Sebastian Kreft, Stefan van der Walt, Stefano Maggiolo, Stefen Yin, Tiffany Zhu, Tristan Hume, Varun Joshi, Óscar Nájera, Akshay Srinivasan, Akshit Agarwal, Amit Jamadagni, Andrew Straw, Barry Wardell, Benjamin McDonald, Bill Flynn, Case Van Horsen, Emma Hogan, Geoffry Song, George Waksman, Heiner Kirchhoffer, Jens H. Nielsen, Julio Idichekop Filho, Luca Weihs, Luis Garcia, Manoj Babu K., Martin Povišer, Nikolay Lazarov, Pan Peng, Raffaele De Feo, Shravas K Rao, Ted Horst, Arpit Goyal, Ashwini Oruganti, Ben Goodrich, Boris Timokhin, Bradley Froehle, Colleen Lee, David Marek, Dmitry Batkovich, Fernando Perez, Goutham Lakshminarayan, Henrik Johansson, Jack McCaffery, James Aspnes, James Fiedler, Jezreel Ng, Jurjen N.E. Bos, Michael Mayorov, Nikhil Sarda, Oleksandr Gituliar, Oscar Benjamin, Pavel Fedotov, Pradyumna, QuaBoo, Sai Nikhil, Thomas Dixon, Thomas Wiecki, Tomáš Bambas, Tuomas Airaksinen, rathmann, tsmars15, Acebulf, Alexander Eberspächer, Alexandr Gudulin, Ali Raza Syed, Anatolii Koval, Andre de Fortier Smit, Andrej Tokarčík, Andrew Docherty, Bastian Weber, Benjamin Fishbein, Bernhard R. Link, Björn Dahlgren, Carsten Knoll, Christian Schubert, Comer Duncan, David Lawrence, Eh Tan, Elrond der Elbenfuerst, Erik Welch, Gert-Ludwig Ingold, Gregory Ksionda, Hubert Tsang, James Abbatiello, James Goppert, James Pearson, Jeremy, Johann Cohen-Tanugi, Jorge E. Cardona, Joseph Dougherty, Kaifeng Zhu, Kazuo Thow, Kevin Goodsell, Kibeom Kim, Konrad Meyer, Lars Buitinck, Madeleine Ball, Marcin Kostrzewa, Markus Müller, Matt Rajca, Matthew Tadd, Matthias Toews, Max Hutchinson, Nicholas J.S. Kinar, Or Dvory, Paul Strickland, Pauli Virtanen, Prateek Papriwal, Puneeth Chaganti, Rizgar Mella, Robert, Robert Cimrman, Roberto Colistete, Jr., Sebastian Krause, Seshagiri Prabhu, Shai 'Deshe' Wyborski, Shruti Mangipudi, Siddhant Jain, Srinivas Vasudevan, Stepan Simsa, Takafumi Arakaki, Tarang Patel, Thomas Sidoti, Tim Lahey, Tyler Pirtle, Vasily Povalyaev, Vinay Kumar, Vinit Ravishankar, Vladimir Lagunov, marshall2389, vishal, Łukasz Pankowski
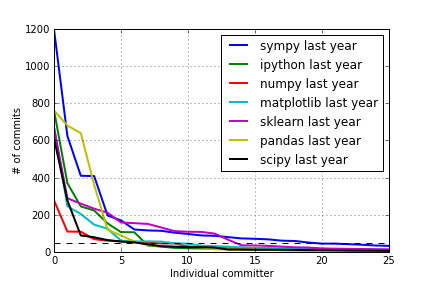
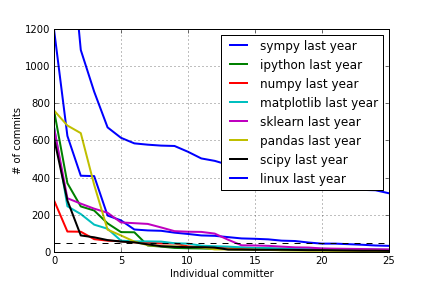
How Open Source Works


Git Commits Plots
Last year:
Git Commits Plots
Last year:
Git Commits Plots
All time:
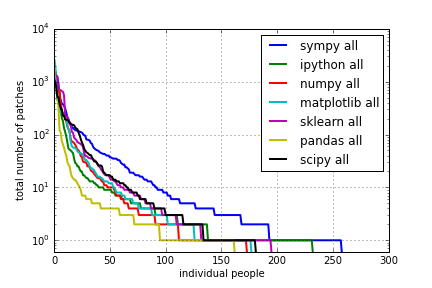
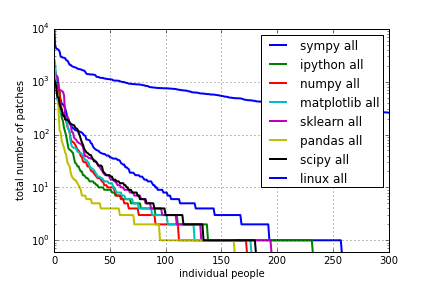
Git Commits Plots
All time:
NumPy 1.7 Release
- Experiences with the release
- How to earn trust
Challenges, weaknesses?
Packaging
- Packaging:
- Package dependencies (full Python stack has easily 50+ packages)
- Python independent (C, C++, Fortran, Python, Ruby, ...)
- builds/installs from source (without root access)
- binary installation
- virtualenv like environments
- reproducibility (like git: one hash should reproduce exactly the same stack)
- Some solutions:
- Conda / binstar (Continuum IO)
- Hashdist (Chris Kees, Dag Sverre Seljebotn, Ondřej Čertík, Aron Ahmadia)
Speed
- Speed matters:
- Cython (wrap Fortran/C/C++):
- pros: best tool to wrap other codes, easily blend C/Python
- cons: you have to master C, Cython and Python (=3 layers)
- Numba: an LLVM JIT for typed code/arrays
- pros: provides nice Python API to generate bare metal speed code
- cons: not mature enough yet
- Julia: an LLVM JIT, new language
- pros: just one language (=1 layer), not Python but integrates seamlessly with Python
- cons: new tool, small community, not mature enough yet
- Cython (wrap Fortran/C/C++):
But: not easy to use as a reusable library in other languages/environments
Modern Fortran
Domain specific language for numeric scientific computing
- basic mathematics in the core language (rich array operations, complex numbers, exponentiation, special functions)
- simple, but feature rich (e.g. automatic memory allocation for arrays)
- fast
Not so good for other things
- Symbolic manipulation
- Databases
- Graphical user interface, plots
- Interactive exploratory work
- Webservers, web interface, system programming (hardware control)
- ...
Python Fortran Rosetta Stone
Python:
from numpy import array, size, shape, min, max, sum
a = array([1, 2, 3])
print shape(a)
print size(a)
print max(a)
print min(a)
print sum(a)
Fortran:
integer :: a(3)
a = [1, 2, 3]
print *, shape(a)
print *, size(a)
print *, maxval(a)
print *, minval(a)
print *, sum(a)
Array and Matrix multiplication
Python:
from numpy import array, dot
a = array([[1, 2], [3, 4]])
b = array([[2, 3], [4, 5]])
print a * b
print dot(a, b)
Fortran
integer :: a(2, 2), b(2, 2)
a = reshape([1, 2, 3, 4], [2, 2], order=[2, 1])
b = reshape([2, 3, 4, 5], [2, 2], order=[2, 1])
print *, a * b
print *, matmul(a, b)
Indexing
Python
from numpy import reshape
a = reshape([1, 2, 3, 4, 5, 6], (2, 3))
b = reshape([1, 2, 3, 4, 5, 6], (2, 3), order="F")
print a[0, :]
print a[1, :]
print
print b[0, :]
print b[1, :]
Fortran
integer :: a(2, 3), b(2, 3)
a = reshape([1, 2, 3, 4, 5, 6], [2, 3], order=[2, 1])
b = reshape([1, 2, 3, 4, 5, 6], [2, 3])
print *, a(1, :)
print *, a(2, :)
print *
print *, b(1, :)
print *, b(2, :)
More info at: http://fortran90.org
Python 2 and 3 transition
Guido van van Rossum (2007):
Python 3.0 will break backwards compatibility. Totally. We're not even aiming for a specific common subset.
Initial recommended way:
- Develop in Pyhon 2, use 2to3 tool
Problems:
- You can't develop in Python 3 (prevents people from switching)
- 2to3 is an effective compilation step -> Python becomes a compiled language, like C/C++/Fortran
- Even if you develop in Python 2, you still need to test every commit using 2to3 (
Travis-CI)- if something breaks, you need to debug it
- except that unlike C/C++/Fortran (
cmake,make, ...), it is not robust- can't integrate well with
setup.py/distutils - For SymPy 0.7.3, it takes 4.5 minutes to run the first time and after that 1.5s with one modified file
- doesn't run in parallel
- Error messages not nice, if you do more complex change, you need to rerun from scratch
- can't integrate well with
Conclusion
- Python is not fun anymore
- My enthusiasm for Python as a platform dropped
Meantime
- Python 2.6 and 2.7 introduced features from Python 3
- Python 3.2 and 3.3 introduced features from Python 2
- It became reasonably simple to use single code base without sacrificing Python features
Solution
The recommended way now:
- Use single code base
- Treat Python 3 as another version of Python, just like Python 2.6 or 2.7
- Use
compatibility.pyfile (i.e.from compatibility import range) - Works for SymPy (over 230k lines, uses almost all Python features)
Conclusion:
- Python 2.6, 2.7, 3.2, 3.3 are just various versions of the same language
- You should really be using the latest version by default (3.3)
Fernando Pérez's words:
- The language lured me in...
- But I stayed for the community!
- Real friendships and incredible people
- A culture of generous and mutual cross-project collaboration
- But we have a ton of work to do!
- The tools we need must be built by scientists.